Indian Institute of Technology Madras
BS Degree Programme · Examination & Study Paper
BSMA1002 · Statistics for Data Science I
Qualifier · September 2023
Examination Instructions & Guidelines
- Solve on notebook/paper first before checking solutions.
- MCQ: Exactly 1 option is correct. Negative marking applies.
- MSQ: One or more options correct. Select all to score.
- NAT: Numerical response. No negative marking.
- Scientific calculator allowed for all calculations.
- Official answer key is sealed at the end of this sheet.
- Q1NAT3 Marks·Write the number
 Your answer:
Read the passage below, then answer Q2–Q3
The Head of the transportation facility at the IIT Madras campus wants to conduct a survey to rate the bus services offered to all the students. He randomly selects 100 final year students from the campus. Based on the given information, answer the subquestions
Q2MSQ3 Marks·Choose all correct optionsIdentify the sample and the population.
- AThe population is all the students at IIT Madras campus.
- BThe sample is all the final year students at IIT Madras campus.
- CThe sample is 100 randomly selected final year students at IIT Madras campus.
- DThe population is all the final year students at IIT Madras campus.
- Q3MCQ2 Marks·Choose one option
Identify the correct statement from the following.
- ASelected sample is a good representation of the population.
- BSelected sample is not a good representation of the population.
Read the passage below, then answer Q4–Q5
 Q4NAT2 Marks·Write the number
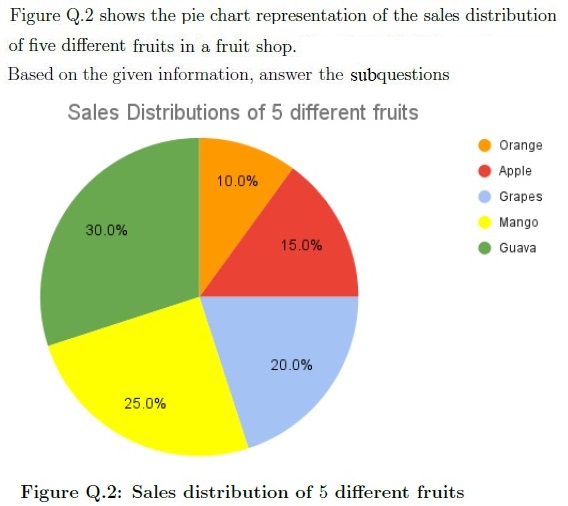
If a total of 500 fruits are sold on a given day, then find the number of mangoes sold.
Your answer:- Q5MSQ3 Marks·Choose all correct options
Choose the correct statement(s) from the following.
- AThe slices of pie chart adds up to 100%.
- BMedian of the data is Grapes.
- CMode of the data is Guava.
- DThe pie chart is misleading because it does not obey the area principle.
Read the passage below, then answer Q6–Q7
 Q6NAT5 Marks·Write the number
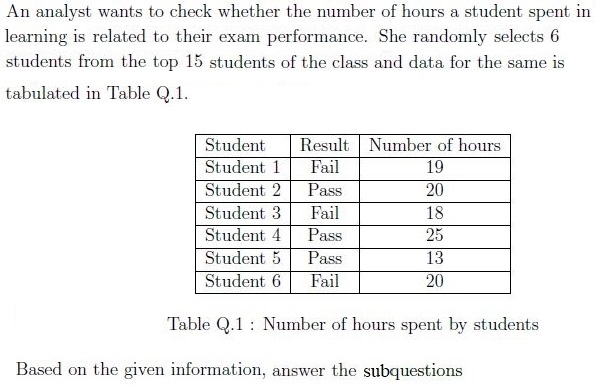
Calculate the absolute value of Point Bi-serial correlation coefficient between the result and number of hours spent. Enter the answer correct to three decimal places.
Your answer:- Q7MCQ2 Marks·Choose one option
Are the exam results of the selected students strongly influenced by the number of hours spent studying?
- AYes, because the absolute value of Point Bi-serial coefficient is close to 1.
- BNo, because the absolute value of Point Bi-serial coefficient is close to 1.
- CYes, because the absolute value of Point Bi-serial coefficient is close to 0.
- DNo, because the absolute value of Point Bi-serial coefficient is close to 0.
Read the passage below, then answer Q8–Q9
 Q8NAT3 Marks·Write the number
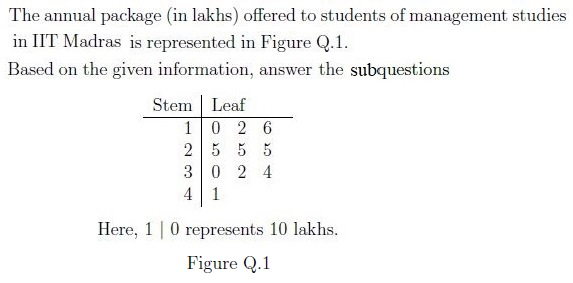
What is the average annual package of the students if each observation is doubled after subtracting 5 from it?
Your answer:- Q9MCQ4 Marks·Choose one option
What is the population variance of the given data if 5 is subtracted from each observations?
- A78.6
- B83.6
- C88.6
- D93.6
- Q10NAT4 Marks·Write the number
 Your answer:
- Q11MSQ2 Marks·Choose all correct options
Which of the following statement(s) is(are) true?
- AEye colour of a person has ordinal scale of measurement.
- BRecording the price of bitcoin every hour for 3 days is a time-series data.
- CNumber of students present in a class is a discrete variable.
- DAmount of milk (in litres) is a categorical variable.
- Q12MSQ2 Marks·Choose all correct options
Sunidhi purchased 5 t-shirts of sizes M, L, S, XL, S for her cousins. Later she purchased one more t-shirt of size M, then choose the correct option(s) from the following:
- AMedian of the new data is same as of old data.
- BNew data will be bimodal.
- CMedian of the new data will change.
- DNew data will be unimodal.
- Q13MSQ3 Marks·Choose all correct options

- A
- B
- C
- D
- A
- Q14NAT2 Marks·Write the number
Find the IQR (Interquartile range) of the data 14, 20, 40, 23 and 18.
Your answer:
Official KeyMaster Answer Key & Explanations
Official answer keys from IIT Madras BS past papers. Click any question to review.
Reveal KeyCollapse Key
Master Answer Key & Explanations
Official answer keys from IIT Madras BS past papers. Click any question to review.
Detailed Answer Notes & Working
- Q1Answer: 10
- Population variance = (3√2)² = 18 and sample variance = (2√5)² = 20. Since n × 18 = (n − 1) × 20, we get 20 = 2n, so n = 10.
- Q2Answer: A, C
- The survey is about bus services for all students, so the population is all students at IIT Madras. The sample is the 100 final year students who were randomly selected.
- Q3Answer: B
- The population is all students, but the sample has only final year students. Other years are left out, so the sample is not a good representation of the population.
- Q4Answer: 125
- Mango has 25% of the pie. Mangoes sold = 25% of 500 = 0.25 × 500 = 125.
- Q5Answer: A, C
- The slices 10 + 15 + 20 + 25 + 30 = 100%. Guava has the largest share (30%), so it is the mode. Fruit type is nominal, so the median is not defined, and the slice areas match the percentages, so the chart is not misleading.
- Q6Answer: 0.04 to 0.05
- Pass hours: 20, 25, 13 (mean 19.33). Fail hours: 19, 18, 20 (mean 19). Population SD of all 6 hours = √(74.83/6) ≈ 3.53. r = (19.33 − 19)/3.53 × √(3/6 × 3/6) ≈ 0.047. Official answer key accepts any value from 0.04 to 0.05.
- Q7Answer: D
- The point bi-serial coefficient is about 0.047, which is very close to 0. So the result is not strongly influenced by the number of hours spent.
- Q8Answer: 40
- Data: 10, 12, 16, 25, 25, 25, 30, 32, 34, 41. Sum = 250, so mean = 25. New value = 2(x − 5), so new mean = 2 × (25 − 5) = 40.
- Q9Answer: C
- Subtracting 5 from every value does not change the variance. Mean = 25. Squared deviations: 225, 169, 81, 0, 0, 0, 25, 49, 81, 256, sum = 886. Population variance = 886/10 = 88.6.
- Q10Answer: 0.29 to 0.35
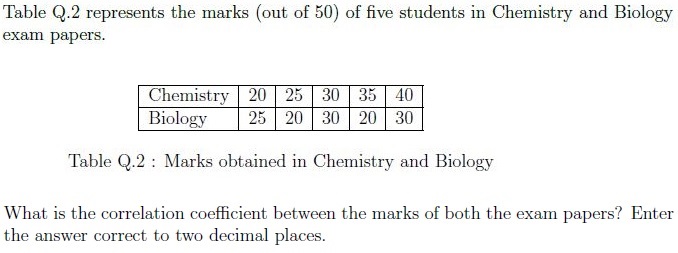
- Means: Chemistry 30, Biology 25. Deviations: (−10, −5, 0, 5, 10) and (0, −5, 5, −5, 5). Σ(products) = 50, Σx² = 250, Σy² = 100. r = 50/√(250 × 100) = 50/158.1 ≈ 0.32. Official answer key accepts any value from 0.29 to 0.35.
- Q11Answer: B, C
- Bitcoin price recorded every hour is data over time, so it is time series. Number of students is a count, so it is discrete. Eye colour has no order, so it is nominal, and amount of milk in litres is numerical (continuous), not categorical.
- Q12Answer: A, B
- Old data in order: S, S, M, L, XL, so the median is M. New data: S, S, M, M, L, XL. The 3rd and 4th values are both M, so the median is still M. S and M now appear twice each, so the data is bimodal.
- Q13Answer: B, D
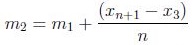
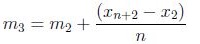
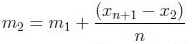
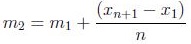
- m₂ − m₁ = [(x₂ + … + xₙ₊₁) − (x₁ + … + xₙ)]/n = (xₙ₊₁ − x₁)/n. In the same way, m₃ − m₂ = (xₙ₊₂ − x₂)/n. So options B and D are true.
- Q14Answer: 5
- Sorted data: 14, 18, 20, 23, 40 (n = 5). Q₁: 0.25 × 5 = 1.25, round up to the 2nd value = 18. Q₃: 0.75 × 5 = 3.75, round up to the 4th value = 23. IQR = 23 − 18 = 5.